
Statistics can look confusing at first, especially when a page is filled with symbols such as μ, σ, x̄, p, n, Σ, and α. Each symbol has a specific meaning, and understanding these common statistical notations makes formulas, research papers, graphs, and data analysis much easier to follow. Instead of memorizing random letters, it helps to understand what each symbol represents and when it is used.
Statistic symbols and meanings can vary depending on the topic, formula, or branch of statistics. Some symbols describe a population, while others represent a sample. For example, μ commonly represents a population mean, while x̄ represents a sample mean. Similarly, σ is often used for population standard deviation, whereas s commonly represents sample standard deviation. Knowing these differences can help you read statistical equations with greater confidence.
In this complete guide, we’ll explain the most common statistical symbols and their meanings in simple language. You’ll learn about symbols for means, standard deviation, variance, probability, sample size, correlation, significance levels, summation, and more. Whether you’re a student, researcher, or simply trying to understand a statistics formula, this guide will give you a clear reference for common statistical notation.
Quick Meaning of Statistic Symbols
Statistic symbols are letters, numbers, and mathematical signs used to represent data values, statistical measures, populations, samples, probabilities, and relationships. Roman letters often describe sample statistics, while Greek letters commonly represent population parameters. Their exact meanings depend on context, capitalization, subscripts, and the formula in which they appear.
Statistic Symbols Overview Table
| Symbol | Name | Primary Meaning | Category | Common Usage |
| x | Individual value | One observation in a dataset | Descriptive statistics | A test score, height, or measurement |
| x̄ | Sample mean | Average of sample values | Descriptive statistics | Estimating a population mean |
| μ | Population mean | Average of an entire population | Population parameter | Theoretical or known population average |
| n | Sample size | Number of observations in a sample | Sampling | Surveys and experiments |
| N | Population size | Number of members in a population | Population data | Census and demographic research |
| s | Sample standard deviation | Sample data spread | Variability | Estimating population variation |
| σ | Population standard deviation | Population data spread | Variability | Probability models and known populations |
| s² | Sample variance | Squared sample standard deviation | Variability | Comparing sample dispersion |
| σ² | Population variance | Squared population standard deviation | Variability | Statistical distributions |
| Σ | Summation | Add a sequence of values | Mathematical operation | Means, variance, and regression formulas |
| p | Probability or proportion | Probability or sample proportion | Probability/inference | Event likelihood or observed percentage |
| p̂ | Sample proportion | Estimated population proportion | Inference | Polling and survey results |
| P | Probability function | Probability of an event | Probability | P(A), meaning probability of event A |
| ρ | Population correlation | Population relationship strength | Correlation | Theoretical correlation |
| r | Sample correlation | Sample relationship strength | Correlation | Pearson correlation |
| β | Population regression coefficient | True predictor effect | Regression | Population regression models |
| b | Sample regression coefficient | Estimated predictor effect | Regression | Sample-based regression |
| α | Significance level | Threshold for rejecting a null hypothesis | Hypothesis testing | Commonly 0.05 |
| p-value | Probability under H₀ | Evidence against the null hypothesis | Hypothesis testing | Statistical significance |
| H₀ | Null hypothesis | Statement of no effect or difference | Hypothesis testing | Baseline claim |
| H₁ or Hₐ | Alternative hypothesis | Statement of an effect or difference | Hypothesis testing | Competing claim |
| z | z-score | Standardized distance from the mean | Standardization | Normal distributions |
| t | t-statistic | Standardized test value | Hypothesis testing | Small samples or unknown σ |
| χ² | Chi-square statistic | Difference between observed and expected values | Categorical analysis | Independence and goodness-of-fit tests |
| df | Degrees of freedom | Independent information available | Inference | t, chi-square, and F tests |
| CI | Confidence interval | Plausible range for a parameter | Statistical inference | Estimation and reporting |
What Do Statistic Symbols Mean?
Statistic symbols represent quantities, operations, assumptions, and conclusions in data analysis. They act as a specialized shorthand that helps readers distinguish between raw observations, calculated sample results, unknown population characteristics, and probability statements.
A particularly important distinction exists between a statistic and a parameter:
- A statistic is calculated from a sample.
- A parameter describes an entire population.
For example, x̄ represents the mean of a sample, while μ represents the mean of a population. Similarly, s represents the sample standard deviation, while σ represents the population standard deviation.
This distinction matters because researchers usually cannot observe an entire population. Instead, they collect a sample and use sample statistics to estimate population parameters.
Capitalization also changes meaning. The lowercase n usually means sample size, whereas uppercase N usually means population size. Lowercase p may represent a probability or sample proportion, while uppercase P often appears as a probability operator, as in P(A).
Statistic symbols therefore do more than shorten formulas. They identify the source, role, and interpretation of each quantity.
History and Origin of Statistical Symbols
Modern statistical notation developed gradually from older mathematical traditions rather than appearing as one complete system. Early mathematicians described calculations mostly in words. As algebra, probability, astronomy, economics, and scientific measurement became more advanced, scholars needed a shorter and more consistent form of notation.
Greek letters entered mathematics through geometry, algebra, and classical scholarship. They later became useful in statistics because they could distinguish unknown population parameters from ordinary sample measurements. This practice is now common, although it is a convention rather than a universal law.
The capital Greek letter Σ, called sigma, became associated with summation because it corresponds to the Greek form of the letter “S,” the first sound in words related to “sum.” It now instructs the reader to add a sequence of terms.
Probability notation developed rapidly between the seventeenth and twentieth centuries as mathematicians studied games of chance, insurance, population records, measurement error, and uncertainty. Later, statistical pioneers created symbols for correlation, regression, standard deviation, hypothesis testing, and probability distributions.
No single international authority created every statistical symbol. Instead, notation evolved through textbooks, academic papers, professional societies, software, and disciplinary traditions. This history explains why one symbol can have more than one meaning.
For example:
- p can mean probability, population proportion, or sample proportion.
- β can mean a regression coefficient or the probability of a Type II error.
- λ can represent a Poisson rate, an exponential rate, or a model parameter.
- θ often represents a general unknown parameter.
Context is therefore essential.
Symbolism and Interpretation in Statistics
Statistic symbols are technical rather than cultural symbols, but their design still communicates important conceptual differences.
Roman Letters Usually Represent Observed Quantities
Letters from the Roman alphabet often represent measurements or values calculated from a sample. Common examples include:
- x for an observed value
- x̄ for a sample mean
- s for sample standard deviation
- r for sample correlation
- b for an estimated regression coefficient
- n for sample size
These symbols usually refer to information that has been collected or calculated.
Greek Letters Often Represent Population Parameters
Greek letters commonly represent fixed but unknown population characteristics:
- μ for population mean
- σ for population standard deviation
- ρ for population correlation
- β for population regression coefficients
- π for population proportion in some textbooks
- θ for an unspecified parameter
The use of Greek letters helps readers recognize that the quantity concerns the population or probability model rather than the observed sample alone.
Hats Indicate Estimates
A hat above a symbol often means that the quantity is an estimate.
For example:
- p̂ is an estimated population proportion.
- ŷ is a predicted value of the response variable.
- β̂ is an estimated regression coefficient.
- θ̂ is an estimate of an unknown parameter.
The hat visually separates an estimated quantity from the true value it attempts to approximate.
Bars Indicate Means
A horizontal bar commonly represents an arithmetic mean:
- x̄ means the mean of x-values.
- ȳ means the mean of y-values.
The bar may also indicate another type of average in specialized fields, so readers should check the surrounding definition.
Subscripts Identify Groups or Positions
Subscripts specify an observation, category, variable, or group.
For example:
- x₁ means the first x-value.
- xᵢ means the value in position i.
- μ₁ and μ₂ represent two population means.
- n₁ and n₂ represent the sizes of two samples.
- p₁ and p₂ may represent two proportions.
Subscripts allow a single symbol family to describe many related quantities without creating a new letter for each one.
Cultural and International Significance
Statistical notation is largely international because mathematics and science depend on communication across languages. A researcher in the United States, Japan, Brazil, Germany, or Nigeria may recognize symbols such as μ, σ, Σ, and χ², even when the surrounding explanation appears in another language.
However, notation is not perfectly universal. Differences may appear across countries, educational systems, academic disciplines, and software platforms.
For example:
- Some textbooks use p for a sample proportion, while others prefer p̂.
- Some use H₁ for the alternative hypothesis, while others use Hₐ.
- Population proportion may appear as p, π, or another parameter symbol.
- Variance may be written as Var(X), V(X), or σ².
- Expected value may appear as E(X), E[X], or μX.
- Decimal commas are used in many countries, while decimal points dominate in US English.
Different fields also develop their own conventions. Psychology, medicine, economics, engineering, machine learning, and social science may present the same ideas with slightly different notation.
These variations do not usually signal different mathematics. They reflect local conventions and disciplinary habits.
Mathematical and Scientific Meanings of Common Statistic Symbols
Measures of Center
x̄: Sample Mean
The symbol x̄, read as “x-bar,” represents the arithmetic mean of a sample.
The formula is:
x̄ = Σx / n
Suppose a sample contains the values 4, 6, 8, and 10:
x̄ = (4 + 6 + 8 + 10) / 4 = 7
The sample mean summarizes the center of the observed data.
μ: Population Mean
The Greek letter μ, pronounced “mu,” represents the mean of an entire population.
Its general formula is:
μ = Σx / N
The population mean may be known when every population member has been measured. More commonly, it is unknown and estimated using x̄.
M or Md: Median
The median is the middle value after data are arranged in order. It is often written as Mdn, Med, or sometimes M. There is no single universal median symbol, so the author should define the notation.
Measures of Variability
s: Sample Standard Deviation
The symbol s measures how far sample values typically spread around the sample mean.
A small s indicates tightly grouped observations. A large s indicates greater dispersion.
σ: Population Standard Deviation
The Greek letter σ, pronounced “sigma,” measures the spread of an entire population.
Standard deviation uses the original units of the data. If heights are measured in inches, the standard deviation is also measured in inches.
s² and σ²: Variance
Variance is the square of standard deviation:
- s² represents sample variance.
- σ² represents population variance.
Variance plays a central role in probability theory, analysis of variance, regression, and statistical modeling.
R: Range
The range is the difference between the maximum and minimum values:
R = maximum − minimum
It is easy to calculate but sensitive to extreme values.
IQR: Interquartile Range
The interquartile range measures the spread of the middle 50 percent of the data:
IQR = Q₃ − Q₁
It is less affected by extreme observations than the full range.
Probability Symbols
P(A): Probability of Event A
The notation P(A) means the probability that event A occurs.
Probability values normally range from 0 to 1:
- 0 means the event is impossible.
- 1 means the event is certain.
- 0.5 means the event has a 50 percent chance.
P(A ∩ B): Intersection
The symbol ∩ means “and.” Therefore, P(A ∩ B) is the probability that both A and B occur.
P(A ∪ B): Union
The symbol ∪ means “or.” Therefore, P(A ∪ B) is the probability that A occurs, B occurs, or both occur.
P(A | B): Conditional Probability
The vertical bar means “given.” Thus, P(A | B) means the probability of A occurring given that B has occurred.
Aᶜ or A′: Complement
The complement of A means that A does not occur.
P(Aᶜ) = 1 − P(A)
Hypothesis-Testing Symbols
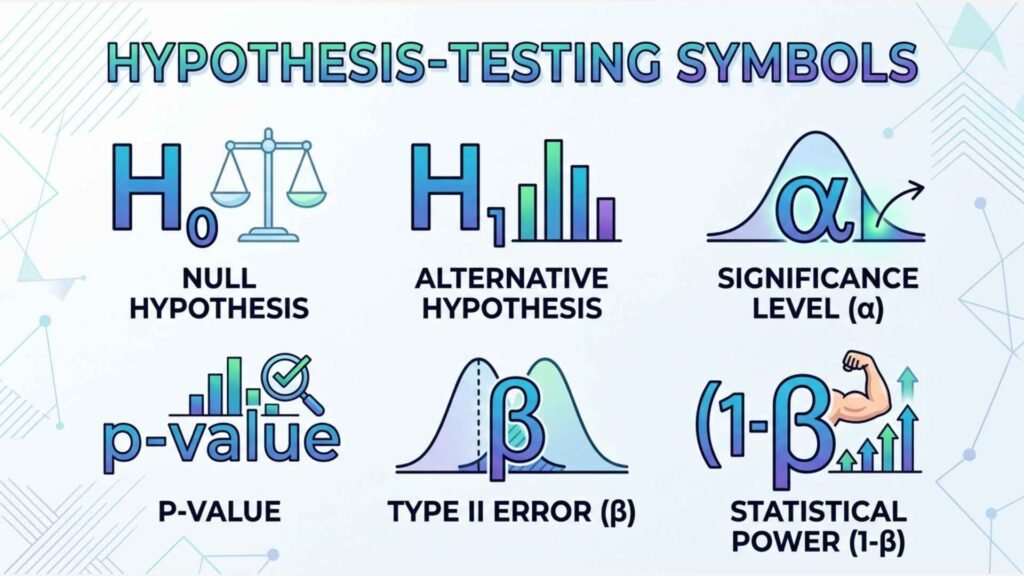
H₀: Null Hypothesis
The null hypothesis states that there is no effect, relationship, or meaningful difference in the population.
An example is:
H₀: μ₁ = μ₂
This states that two population means are equal.
Hₐ or H₁: Alternative Hypothesis
The alternative hypothesis states that an effect, relationship, or difference exists.
Examples include:
- Hₐ: μ₁ ≠ μ₂
- Hₐ: μ₁ > μ₂
- Hₐ: μ₁ < μ₂
α: Significance Level
The symbol α, pronounced “alpha,” is the threshold chosen for deciding whether evidence against the null hypothesis is strong enough.
A common choice is α = 0.05, but this value is a convention, not a universal law. The appropriate threshold depends on the research context and consequences of error.
p-value
The p-value measures how compatible the observed results are with the null hypothesis under the assumptions of the statistical test.
A p-value smaller than α commonly leads researchers to reject H₀. It does not measure the probability that H₀ is true, and it does not show the size or practical importance of an effect.
β: Type II Error Probability
In hypothesis testing, β can represent the probability of failing to reject a false null hypothesis.
Statistical power is:
Power = 1 − β
A powerful study has a greater chance of detecting a real effect.
Relationship and Regression Symbols
r: Sample Correlation
The symbol r often represents Pearson’s sample correlation coefficient. It measures the direction and strength of a linear relationship between two quantitative variables.
Its values range from −1 to +1:
- r = +1 indicates a perfect positive linear relationship.
- r = −1 indicates a perfect negative linear relationship.
- r = 0 indicates no linear relationship.
Correlation does not by itself prove causation.
ρ: Population Correlation
The Greek letter ρ, pronounced “rho,” represents the population correlation coefficient. The sample value r is used to estimate it.
b₀ and b₁: Sample Regression Coefficients
In a simple linear regression equation:
ŷ = b₀ + b₁x
- b₀ is the estimated intercept.
- b₁ is the estimated slope.
- ŷ is the predicted response.
- x is the predictor value.
β₀ and β₁: Population Regression Coefficients
The Greek symbols β₀ and β₁ represent the true population intercept and slope. The sample coefficients b₀ and b₁ estimate them.
Distribution and Standardization Symbols
z: Standard Score
A z-score measures how many standard deviations a value lies above or below the mean:
z = (x − μ) / σ
A positive z-score is above the mean. A negative z-score is below it.
t: t-Statistic
The t symbol represents a test statistic from a t-distribution. It is commonly used when the population standard deviation is unknown, especially with smaller samples.
χ²: Chi-Square Statistic
The symbol χ², pronounced “chi-square,” measures differences between observed and expected frequencies.
It is commonly used for:
- Tests of independence
- Goodness-of-fit tests
- Tests involving population variance
F: F-Statistic
The F statistic compares variance estimates. It commonly appears in analysis of variance, regression, and tests comparing nested models.
df: Degrees of Freedom
Degrees of freedom describe how many independent pieces of information remain after accounting for estimated quantities or restrictions.
For a one-sample variance calculation:
df = n − 1
The exact formula depends on the statistical method.
Where Statistic Symbols Are Used
Statistic symbols appear wherever people collect, summarize, compare, or model data.
Education
Students encounter statistical notation in mathematics, psychology, economics, biology, sociology, and business courses. Symbols help them move from verbal reasoning to formal calculations.
Scientific Research
Researchers use symbols to state hypotheses, define models, report estimates, and explain uncertainty. Standard notation allows other researchers to understand and reproduce an analysis.
Medicine and Public Health
Clinical trials use symbols for sample sizes, treatment effects, confidence intervals, risk ratios, probabilities, and significance tests. Correct interpretation can affect healthcare decisions.
Business and Finance
Analysts use statistical symbols in forecasting, quality control, market research, portfolio analysis, risk modeling, and customer analytics.
Engineering
Engineers apply statistics to reliability testing, manufacturing tolerances, process control, signal analysis, and experimental design.
Technology and Data Science
Programming languages and analytical software display estimates, standard errors, regression coefficients, probabilities, and performance measures. Software may use words instead of mathematical symbols, but the underlying concepts remain the same.
Surveys and Opinion Polls
Poll results commonly use n, p̂, confidence intervals, standard errors, and margins of error. These symbols help readers judge how precisely a sample reflects a larger population.
Common Variations in Statistical Notation
Statistical symbols may change depending on the textbook, discipline, or software.
Sample Proportion: p or p̂
Some introductory materials use p for the sample proportion. Others use p̂ to emphasize that the sample proportion estimates a population value.
Population Proportion: p or π
A population proportion may appear as p or the Greek letter π. This π is a parameter symbol and should not automatically be confused with the geometric constant 3.14159.
Mean: M, x̄, or μ
The sample mean is usually x̄, but some research reports use M. The population mean is commonly μ.
Standard Deviation: SD, s, or σ
Authors may write SD in ordinary text, s for a sample, and σ for a population.
Standard Error: SE or SE(x̄)
Standard error may be written simply as SE, or with the estimated quantity shown in parentheses.
Alternative Hypothesis: H₁ or Hₐ
Both forms are accepted. The choice usually reflects the style of a textbook or field.
Common Misconceptions About Statistic Symbols
A p-Value Is Not the Probability That the Null Hypothesis Is True
A p-value is calculated under the assumption that the null hypothesis and model conditions hold. It does not directly state the probability that H₀ is correct.
Statistical Significance Does Not Prove Practical Importance
A tiny effect can become statistically significant in a very large sample. Researchers should also examine effect sizes, confidence intervals, costs, and real-world consequences.
x̄ and μ Are Not Interchangeable
The symbol x̄ describes a sample mean. The symbol μ describes a population mean. They may be numerically close, but they represent different concepts.
σ Is Not Always a Summation Symbol
Lowercase σ usually represents population standard deviation. Uppercase Σ represents summation. Case changes the meaning.
r = 0 Does Not Prove That Two Variables Are Unrelated
A zero Pearson correlation indicates no linear relationship. A curved or otherwise nonlinear relationship may still exist.
A Hat Does Not Mean “Approximately Equal”
A hat usually indicates an estimate or prediction. Approximate equality is more commonly shown with ≈.
N Does Not Always Mean Sample Size
The common convention uses n for a sample and N for a population, but authors may define them differently. Always check the notation guide.
Symbols Do Not Replace Definitions
No notation is completely self-explanatory. A well-written report defines uncommon symbols and explains the statistical method being used.
Interesting Facts About Statistic Symbols
- Capitalization can completely change meaning.
Lowercase σ usually means population standard deviation, while uppercase Σ means to add a sequence of terms. - The same symbol may represent different ideas.
The letter p can mean probability, proportion, or p-value depending on its placement and context. - A hat communicates estimation.
Symbols such as p̂, ŷ, and β̂ tell readers that the displayed value estimates or predicts another quantity. - Subscripts create a compact indexing system.
Instead of naming hundreds of observations separately, statisticians write x₁, x₂, and xᵢ. - Greek letters usually mark model-level quantities.
They are frequently used for population parameters because they visually differ from sample statistics. - Some statistical terms lack one official symbol.
The median and mode may be written in several ways, so clear definitions remain important. - Software often translates symbols into text labels.
A program may display “Std. Error,” “Estimate,” or “Pr(>|t|)” rather than traditional notation. - Degrees of freedom are not always whole-sample counts.
Some advanced procedures produce approximate, non-integer degrees of freedom. - The vertical bar has several statistical uses.
It can mean “given” in conditional probability or divide arguments within a probability distribution. - Statistical notation continues to evolve.
New fields such as machine learning, Bayesian analysis, and computational statistics adapt older symbols and introduce additional conventions.
Related Mathematical and Statistical Symbols
| Symbol | Meaning | How It Differs |
| = | Equal to | Indicates exact equality |
| ≠ | Not equal to | Shows two quantities differ |
| ≈ | Approximately equal to | Indicates a close numerical value |
| < | Less than | Compares two quantities |
| > | Greater than | Compares two quantities |
| ≤ | Less than or equal to | Includes equality |
| ≥ | Greater than or equal to | Includes equality |
| ∑ | Summation | Adds listed or indexed terms |
| ∏ | Product | Multiplies indexed terms |
| √ | Square root | Reverses squaring |
| ∞ | Infinity | Represents no finite bound |
| ∝ | Proportional to | Shows quantities vary by a constant ratio |
| ∩ | Intersection | Events or sets shared by both groups |
| ∪ | Union | Events or sets in either group |
| ∅ | Empty set | A set containing no elements |
| ∈ | Is an element of | Shows membership in a set |
| ∉ | Is not an element of | Shows absence from a set |
Frequently Asked Questions
What are the most common statistic symbols?
The most common statistic symbols include x̄ for sample mean, μ for population mean, s for sample standard deviation, σ for population standard deviation, n for sample size, N for population size, Σ for summation, p for probability, and r for sample correlation.
What is the difference between x̄ and μ?
x̄ represents the average calculated from a sample, while μ represents the average of an entire population. Researchers often calculate x̄ because measuring every member of a population is impractical. The sample mean then serves as an estimate of the unknown population mean.
What does the sigma symbol mean in statistics?
Lowercase σ usually represents population standard deviation, which measures the spread of population values around the mean. Uppercase Σ means summation and tells the reader to add multiple terms. Although both are forms of the Greek letter sigma, capitalization gives them different statistical meanings.
What does n mean in statistics?
Lowercase n usually represents the number of observations in a sample. For example, if a survey includes 500 participants, then n = 500. Uppercase N commonly represents the total number of members in the population, although authors should always define their notation.
What does p mean in statistics?
The symbol p may represent probability, a proportion, or a p-value. In P(A), it refers to the probability of event A. In survey analysis, p or p̂ may represent a proportion. In hypothesis testing, the p-value measures how compatible the data are with the null hypothesis.
What does α mean in statistics?
The Greek letter α usually represents the significance level chosen before a hypothesis test. It defines the threshold for rejecting the null hypothesis. A common value is 0.05, but researchers may choose a stricter or less strict level depending on the field and consequences of an incorrect conclusion.
What do H₀ and H₁ mean?
H₀ represents the null hypothesis, which usually states that no population effect, difference, or relationship exists. H₁ or Hₐ represents the alternative hypothesis, which states that an effect, difference, or relationship exists. Statistical tests compare the observed evidence with the prediction under H₀.
What does a hat above a statistical symbol mean?
A hat usually indicates that the quantity is estimated from data. For example, p̂ is an estimated population proportion, β̂ is an estimated regression coefficient, and ŷ is a predicted response value. The hat separates the estimate from the unknown true parameter or actual observation.
What does r mean in statistics?
The symbol r commonly represents the Pearson sample correlation coefficient. It measures the strength and direction of a linear relationship between two quantitative variables. Values range from −1 to +1. A value near zero suggests weak linear association, but it does not rule out a nonlinear relationship.
Why do statistics use Greek letters?
Greek letters help distinguish unknown population parameters and model quantities from observed sample statistics. For example, μ represents a population mean, while x̄ represents a sample mean. This is a widely used convention rather than an absolute rule, so definitions and context remain important.
Key Takeaways
- Statistic symbols provide a compact language for describing data, probability, estimation, and inference.
- Roman letters commonly represent sample observations and calculated statistics.
- Greek letters often represent population parameters or theoretical model values.
- x̄ means sample mean, while μ means population mean.
- s means sample standard deviation, while σ means population standard deviation.
- Uppercase Σ means summation.
- Hats usually indicate estimates or predictions.
- Subscripts identify observations, variables, groups, or model components.
- One symbol can have several meanings, so context is essential.
- Statistical significance should not be confused with practical importance.
- Authors should define unfamiliar notation rather than assume every reader knows it.
Conclusion
Statistic symbols make it possible to communicate complicated data concepts with clarity and precision. They show whether a value comes from a sample or population, whether it is observed or estimated, and whether it describes an average, probability, relationship, spread, or test result.
The most important habit is to read every symbol in context. Capital letters, Greek letters, hats, bars, and subscripts all carry information. Once you understand these visual conventions, formulas stop looking like disconnected marks and begin to tell a clear statistical story.
Learning statistic symbols is therefore not only about memorizing notation. It is about understanding how researchers organize evidence, express uncertainty, test claims, and draw responsible conclusions from data.

I am Amelia Carter, an English language educator and educational writer who enjoys making difficult ideas simple and easy to understand. At LearnNestly, I write about English words, grammar, everyday expressions, and language questions that people often find confusing. I believe learning should feel practical, clear, and enjoyable rather than overwhelming. Through my writing, I try to give readers explanations they can understand and use in real life.
Books:
- The Everyday English Handbook
- Words Made Simple
 Daniel Brooks